An ETL and BI solution needs to strive for a user-friendly reporting tool, because a BI solution without users is a failure, and a system that is too complicated to learn and incorporate into everyday use, is a disaster. Dashboards and power pivots are visual, real-time reflections of operational activities, and balanced scorecards blend operational, marketing, developmental and financial aspects.
EIQ2 monitors processing and active tasks and provides an array of ease-of-use reports (Status, Trends, Process Flows, Graphs and KPIs, Drill-Downs etc.) in an easily consumable format, to support the administration and maintenance of the EIQ2 environment. Some of these reports concentrate on ETL process flows, such as timings, record counts and data changes. Other reports focus on historical comparisons, data cleansing and auditing and error management.
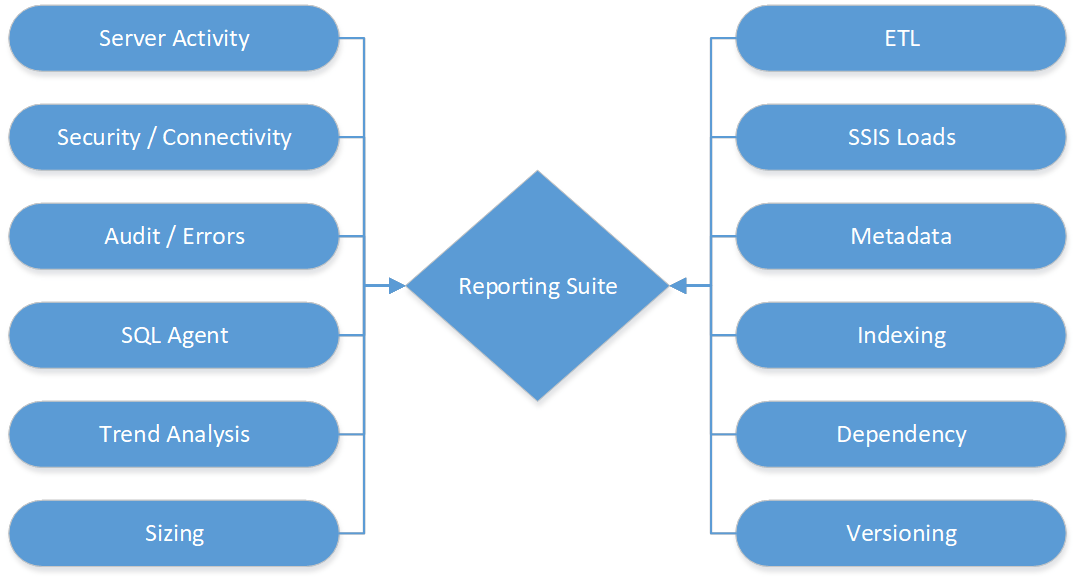
EIQ2 reports reflect the following categories: